Skip to Content

Geography

Geography banner

Damming the Yangtze at Three GorgesBookmark

Learning area: Geography
Year level: Year 7, Year 8
Country: China

This learning sequence investigates the controversy surrounding the Three Gorges Dam and the impact it has had on the Chinese people and environment. Students explore the use of infographics, maps and websites to convey information and opinion and design their own infographic to communicate their understanding of the human and environmental impacts of the Three Gorges Dam.

Key inquiry questions

  • What impact has the Three Gorges Dam had on the people and the environment?
  • What are the most significant human and environmental impacts of the Three Gorges Dam?
  • How can information be visually presented to effectively communicate your ideas?


Three Gorges DamInfographic about the Three Gorges Dam

Related resources

Activity 1: Dam the river, watch the impact

In this activity, you will use infographics, maps and websites to gain a deeper understanding of the human and environmental impacts of the Three Gorges Dam.

Key inquiry question: What impact has the Three Gorges Dam had on the people and the environment?

Positive and negative impacts from development projects

For almost a century Chinese governments considered building a dam across the Yangtze River at Three Gorges. In 2012, after 18 years of construction, the dam became fully functional.

  1. Think about any major building or construction project in your area. This could be a road, a shopping mall, a housing development, or even a school.
  2. Brainstorm, as a class, as many building or construction projects as you can.
  3. Decide which is the biggest construction project that most interests you or you know most about.
  4. Make a four-column table with the headings: People–Good, People–Bad, Environment–Good and Environment–Bad.
  5. Review your lists, then answer the questions:
    • What impacts do large construction projects have on people?
    • What impacts do large construction projects have on the environment?

Presenting your case with infographics

  1. Look at the Three Gorges Dam infographic. View the Wikipedia page on the Three Gorges Dam, and the information in the infographic was drawn.
  2. Make two lists of information you find in the infographic: one list with facts about the impact on people; the other with facts about the impact on the environment.
  3. Review your new lists. What would you like to know more about?
  4. Write four questions: two related to impacts on the people, and two about impacts on the environment.
  5. Compare what you have learned from the infographic to what is on the Wikipedia page.
  6. Which of the two sources of information do you prefer? Which has more information?
  7. View the infographic critically. Are some kinds of information more easily presented on an infographic than others?
  8. Is information lost in the process of turning it into an infographic?
  9. Is the infographic conveying facts, opinion or both?

Acknowledgements

Image: Three Gorges Dam by GDS Infographics (CC BY 2.0)

Activity 2: Yangtze before and after 1987-2006

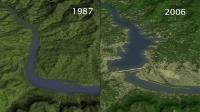
In this activity you will assess the impact of Three Gorges Dam through use of a NASA-generated visualisation to show what the Yangtze River was like before and after the dam was built.

Key inquiry question: What are the most significant human and environmental impacts of the Three Gorges Dam?

Impact of damming on people and the environment

  1. View the NASA visualisation, created from satellite images showing the Yangtze River before and after construction of the Three Gorges Dam, and read the information.
  2. Imagine what impact the dam would have on people living upstream and list three impacts the dam might have.
  3. Find the Three Gorges Dam on Google Maps. Use the Yangtze River Basin map to help you locate it. Once you have located the dam in Google maps, zoom in, switch between map and satellite views so you get a sense of its impact on the local area.
  4. On the Google map there is a satellite feature with a drop down menu in the upper right hand corner. Select 'photos' in the menu for more images.
  5. Zoom in and view at least five photos around the Yangtze River and the Three Gorges Dam.
  6. Drag the map upstream and hover over at least ten photos looking for details that show the impact of the dam upstream. You might see images of landslides, industries like mining, and villages as well as landscape scenery taken by tourists.
  7. Make a list with two columns: one headed 'Impact on people' and the other 'Impact on the environment'.
  8. Raise two questions each for what you'd like to learn more about the following topics:
    • the dam's impact on the Chinese people
    • the dam's impact on the environment.

More

  • Rise of the Three Gorges Dam – a three-part animation that documents the rise of the dam, including several photographs giving a bird's eye view, from the NASA website.

Acknowledgements

Credit: Much of this information is taken from the NASA Landsat website. NASA's content is in the public domain.
Images: Satellite images from NASA/Goddard Space Flight Center Scientific Visualization Studio United States Geological Survey (Licensing information); Aerial photos from ISS019-E-7720 by The Gateway to Astronaut Photography of Earth. Image courtesy of the Image Science & Analysis Laboratory, NASA Johnson Space Center

Activity 3: Creating your own infographic

In this activity, you will create an infographic to focus your opinion on what you think everyone should know about this topic. You will select new information and present your ideas effectively.

Key inquiry question: How can information be visually presented to effectively communicate your ideas?

Create an infographic

  1. Review what you already know.
  2. Look through your notes, especially the columns focused on the impacts of the Three Gorges Dam on people and the environment.
  3. Start to give shape to your knowledge bank of facts by clustering them into a mindmap. Scan your notes and create groups of information so you can see just by the size of the branch of a cluster how important that topic is. For example, do you have lots of facts about the lost heritage in the submerged villages and little on landslide?
  4. Check all your notes from the previous activities for anything else you might want to include.
  5. Gather more information. What you already know is a good start but, as you begin to create your infographic, you will find that you need more information to be persuasive.
  6. Skim the article China admits Three Gorges Dam has 'urgent problems' as drought persists. Again, this may challenge your reading level, but you don't have to understand everything in the article. Focus on the topics you already know something about and want to learn more about.
  7. Read for information and add important facts to your mindmap.
  8. Try to add information to any section that has little or no information.
  9. Study the work of an Australian graphic artist who created one of the most popular infographics available online. Jane Genovese is renowned for her posters on the environment. One of them is an infographic on the impacts of global warming (on the right).
  10. Look carefully at how Genovese uses colour, shapes and facts to engage you.
  11. Analyse the main opinion communicated by the graphic.
  12. Review your cluster and use it as a guide for your own colourful infographic.
  13. Use your best artistic talents, whether this is to draw freehand as Ms Genovese does or to use software like PowerPoint or some of the 4 Simple Online Infographic Generators
  14. Create a draft infographic where you focus on specific information you want to include and how you want to group it.
  15. Consider now what images or icons you want to use to visually represent some of the main ideas.
  16. Look at more samples of infographics from A Collection Of Infographics That Are Actually Well Designed.
  17. Spend time brainstorming what you like about other designs and what you want to include in yours.
  18. Take time to complete a final version of your infographic that communicates your answer to the big question:
    • What are the biggest impacts the Three Gorges Dam has had on both people and the environment?

Activity 4: Reflection

You have come a long way from considering building projects in your own local area to travelling back in time to the China of 1987 before construction began on the Three Gorges Dam.

You have explored in depth the impact this massive dam has had on both people and the environment.

Finally, you tapped into your artistic and design abilities to communicate your understanding and opinions with others.

  1. Reflect on what you have learned about China and the environment.
  2. Consider how you have learned to gather information and present new knowledge through infographics.

You can engage in open reflection or complete the prompt, 'I used to think… but now I think…'

In this learning sequence, students use infographics, maps and websites to gain a deeper understanding of the human and environmental impacts of the Three Gorges Dam.

Students observe how infographics are used to convey persuasive arguments by reducing complex information to more readily comprehensible key facts and comparisons. Students create their own infographic to demonstrate their understanding of the human and environmental impacts of the Three Gorges Dam.

Activity 1: Dam the river, watch the impact

Students are asked to reflect on large construction projects in their own area. This sensitises them to the human and environmental impacts any large building project will have. Students examine a simple infographic that show's how to reduce text and increase understanding by using comparisons (e.g the length of the reservoir would take 5.7 days to walk).

Infographic interpreting data about the Three Gorges Dam
Three Gorges Dam – infographic on Flickr reduces text and uses images in an effort to engage viewers and inspire further learning.

Activity 2: Yangtze before and after

Exploration of the topic is initiated through use of a NASA-generated visualisation which gives students a birds-eye view before and after completion of the Three Gorges Dam. This provides a context and intuitive sense of the dam's impact before turning to Google Satellite and Maps views of the area where they are coached to virtually explore the terrain and photos that people have posted. The 'show photos' feature of Google Maps may be unknown to students but it reveals both postcard-perfect landscapes as well as landslides and devastated villages.

Video animation
NASA visualisation – NASA-generated visualisation that shows before and after views of the Yangtze River near Three Gorges. Students are asked to imagine the impacts on both people and environment.

Activity 3: Creating an infographic

Once students have acquired solid data, the inquiry process shifts to a creative synthesis phase. Students refer to numerous examples of infographics showing the impacts of global warming.

Activity 4: Reflection

Finally, students reflect on what they have learned. It will be interesting to see how many of the students were able to make a significant connection between their feelings about the impacts of local building projects with the impact Chinese people may have experienced.

Useful websites

More from Jane Genovese:
Other helpful links
Resources on The Three Gorges Dam

It is recommended that teachers preview websites to ensure they are suitable for their students prior to use in class. Content accessed via these links is not owned or controlled by Asia Education Foundation and is subject to the terms of use of the associated website.

The full resource can not be displayed on a mobile device.

back to top